 Siddharth Saoji
Summary
This is an exploration into creating email alerts (with news articles) when chosen stock prices show drastic deviation; using a combination of Google Sheet functions and Google app script.
Purpose of the solution
Let me set context on why I took on this exploration. I am a novice stock investor, and what little I know of it is boiled down to a simple mantra of “You need topical information to make a buy or sell decision, in a relevant time frame”. For me this meant keeping an eye on stocks of interests (ones I own or want to own) and reading as much about them as possible.
Though stock trading is not my day job, I do it in the hope of having a passive income outside of my primary income source. This meant I needed to save time by automating the monitoring and extracting information part. Now I am sure there would be commercial systems which could do what this is doing, the reason I chose to build was for customizability (apply my trigger logic), Cost (its free) and relative speed in building with emergence of Chat-GPT (faster than the many-many stackoverflow searches i would have needed).
Design of the solution
First step in the design process was to define logic to trigger an alert. I only wanted to spend time on a stock if the price deviation was anomalous. So my first trigger was Z-score (also called standard score ), it would tell me compared to the usual trend of ups and downs in the price did something more happen that took the price outside of the recent price oscillation range.
Formula → Z = (X — μ) / σ
Where:
- Z is the Z-score,
- X is the current price of the stock,
- μ is the average (I took 7 day average) of the stock price,
- σ is the standard deviation (again 7 day) of the stock price.
My threshold for z score trigger is > 3, this is my empirical estimate, something that i will test out for a few days and change if it does not give expected results. Z score in itself could be a sufficient indicator of anomaly, though sometimes the standard deviations are within a small range making the Z score non representative of an anomaly in isolation, here I used a second trigger of percentage difference between 7 day average and current price. If the percentage difference was greater than 10% AND Z-score > 3 , I defined it as an anomaly. Note that the percentage difference threshold of 10% is also empirical and could be changed on performance.
Second step was to figure, why was there an anomalous price movement (upward or downward) on the stock. News generally covers these events, so I decided to extract the news articles with the stock name as the keyword. Note here that I am not trying to predict something that few people know about, instead I am trying to keep up with a trend and make informed decisions.
Third step was to find the tools which could 1) allow implementing above basic statistical calculations with stock prices 2) Have the necessary integrations to pull live stock prices and news articles on demand. For the sake of brevity I will not go through the process of selecting the tools for the job, I played around with a few to finally zero-in on Google sheets (easy to configure and free) , Google app script and Google news RSS feed (compatible with former and qualifies the privacy and security risk to Google only).
Implementation of the solution
Implementation was powered by progressively effective Chat-GPT prompting and task pertinent Google sheet functions. Below is the screenshot of a sample Google sheet (with the same structure as mine):
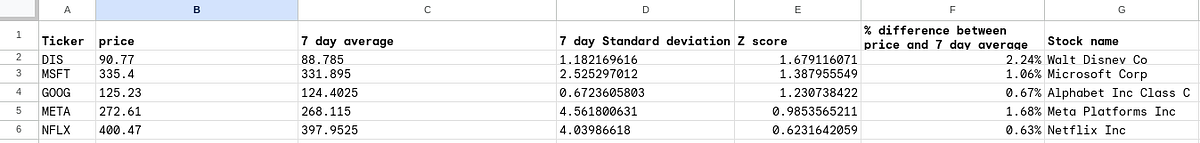
Below are formulas for each column with row 2 as an example.
price -> =GOOGLEFINANCE(A2, “price”)
7 day average -> =AVERAGE(QUERY(GOOGLEFINANCE(A2,“close”,TODAY()-8,TODAY()-1),“Select Col2”))
7 day standard deviation -> =STDEVP(QUERY(GOOGLEFINANCE(A2,“close”,TODAY()-8,TODAY()-1),“Select Col2”))
Z score -> =(B2-C2)/D2
% difference between price and 7 day average -> =(B2-C2)/C2
stock name -> =GOOGLEFINANCE(A2, “name”)
I will not go through each formula as price , stock name and % difference between price and average are self explanatory, Z score is based on formula above. One I will highlight is the 7 day average (similar logic for 7 day standard deviation) formula which uses the GOOGLEFINANCE, QUERY, and AVERAGE functions to calculate the average closing price of a stock over the last 7 days (excluding today). Here’s how each part of the formula works:
GOOGLEFINANCE(A2,"close",TODAY()-8,TODAY()-1): This part of the formula uses theGOOGLEFINANCEfunction to fetch the closing prices of a stock."close"indicates that we’re interested in the closing prices of the stock.TODAY()-8andTODAY()-1specify the date range for which to fetch the prices.TODAY()-8is 8 days ago, andTODAY()-1is yesterday, so this fetches the closing prices for the last 7 days (excluding today).QUERY(..., "Select Col2"): This part of the formula uses theQUERYfunction to select the second column (Col2) from the data returned by theGOOGLEFINANCEfunction. TheGOOGLEFINANCEfunction returns a two-column array, with the first column being the dates and the second column being the closing prices. Therefore, “Select Col2” selects just the closing prices.AVERAGE(...): Finally, this part of the formula uses theAVERAGEfunction to calculate the average of the closing prices returned by theQUERYfunction.
So, the entire formula calculates the average closing price of the stock (specified in cell A2) over the last 7 days (excluding today).
After the spreadsheet was setup next step was writing the Google app script logic to read from the spreadsheet, and pull information based on calculation output. I am pasting the code below for this, its fully commented to explain each section.
// Function to send email alerts
function sendEmailAlert() {
// The ID of the spreadsheet where the data is stored
var spreadsheetId = “Enter your spreadsheet’s ID found in URL”; // Replace with the actual ID of your spreadsheet
// Accessing the spreadsheet by its ID
var spreadsheet = SpreadsheetApp.openById(spreadsheetId);
// Getting the active sheet within the spreadsheet
var sheet = spreadsheet.getActiveSheet();
// The number of the column to check; for example, column E is 5
var columnToCheck = 5; // Update to the column number you want to check (e.g., column C is 3)
// Getting the range of cells in the column to check, starting from row 2
var dataRange = sheet.getRange(2, columnToCheck, sheet.getLastRow() - 1, 3); // We also fetch the column 6 here by specifying 2 as the number of columns to fetch
// Fetching the values from the specified range of cells
var values = dataRange.getValues();
// Get the script properties
var scriptProperties = PropertiesService.getScriptProperties();
// Looping through each value in the column
for (var i = 0; i < values.length; i++) {
// If the absolute value in column 5 is greater than 3 and the value in column 6 is greater than 10
if (Math.abs(values[i][0]) > 3 && Math.abs(values[i][1]) > 0.1) {
// Generate an ID for this alert
var alertId = ‘alert-’ + (i + 2);
  // Check if this alert has already been sent today
  var sentAlert \= scriptProperties.getProperty(alertId);
  if (sentAlert !== null) {
    continue;
  }

 var column7Value \= values\[i\]\[2\];
// Define the stock name
var stockname = column7Value;
// Fetch the news for the stock name
var newsString = fetchStockNews(stockname);
  // The email address to send the alert to
  var recipient \= "your-email@example.com";

  // The subject line for the alert email
  var subject \= "Stock price change Alert! --> " + column7Value ;

  // The body of the alert email, now including the entire row
 var body \= column7Value  + " has shown anomolous change in price " + "\\n\\n" + newsString;


  // Sending the alert email
  MailApp.sendEmail(recipient, subject, body);

  // Mark this alert as sent
  scriptProperties.setProperty(alertId, 'sent');
}
}
}
// Function to clear sent alerts
function clearSentAlerts() {
// Clear all script properties
PropertiesService.getScriptProperties().deleteAllProperties();
}
// Function to set```javascript
// Function to set the trigger for the email alerts
function setHourlyTrigger() {
// Creating a new time-based trigger that runs the “sendEmailAlert” function every hour
ScriptApp.newTrigger(“sendEmailAlert”)
.timeBased()
.everyHours(1)
.create();
// Creating a new daily trigger that runs the “clearSentAlerts” function every day at a specific time
ScriptApp.newTrigger(“clearSentAlerts”)
.timeBased()
.atHour(0) // This sets the trigger for midnight; change the hour as needed
.everyDays(1)
.create();
}
// Function that runs when the spreadsheet is opened
function onOpen() {
// Setting the triggers when the spreadsheet is opened
setHourlyTrigger();
}
function fetchStockNews(stockname) {
// Get the current date and the date seven days ago
var currentDate = new Date();
var pastDate = new Date();
pastDate.setDate(currentDate.getDate() - 7);
// Format the dates in the YYYY-MM-DD format
var currentDateString = currentDate.toISOString().split(‘T’)[0];
var pastDateString = pastDate.toISOString().split(‘T’)[0];
// Define the URL for the Google News RSS feed for this stock name
// Add the date range filter to the query
var url = “https://news.google.com/rss/search?q=” + stockname + “+after:” + pastDateString + “+before:” + currentDateString;
// Fetch the RSS feed
var rss = UrlFetchApp.fetch(url).getContentText();
// Parse the RSS feed
var xml = XmlService.parse(rss);
var root = xml.getRootElement();
var channel = root.getChild(‘channel’);
var items = channel.getChildren(‘item’);
// Extract the title and link of each news item
var news = [];
for (var i = 0; i < items.length; i++) {
var title = items[i].getChild(‘title’).getText();
var link = items[i].getChild(‘link’).getText();
news.push({title: title, link: link});
// Break the loop if we already have 5 news items
if (news.length >= 5) {
break;
}
}
// Format the news into a string
var newsString = ‘Here are the 5 latest news articles for ’ + stockname + ’:\n\n’;
for (var i = 0; i < news.length; i++) {
newsString += news[i].title + ‘\n’ + news[i].link + ‘\n\n’;
}
// Return the news string
return newsString;
}
Two notes that are not evident but essential.
- For the script to run every hour you will need to set a timer on the app script page. Screenshot below:
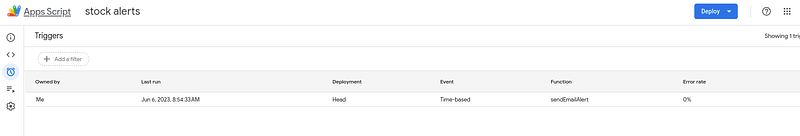
2. Once we have set hourly alerts, they will lead to your mailbox getting spammed if the thresholds are passed for a stock. To avoid this the code includes a logic of not re-sending the same alert again within the day.
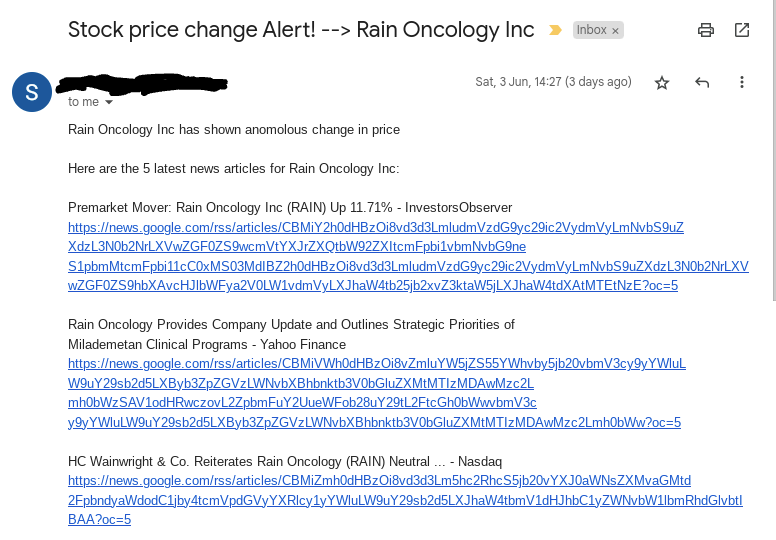
After you have finished above steps, you can test output with a run on the app script editor to see how the test email looks like, for that you would need a stock that has passed the thresholds, if you dont see it, you can just create a dummy one with values above thresholds. Here is how an email looked for me:
Concluding Notes
- The thresholds set (for Z score and % difference) are on perennial trial, and should be re-visited every few months to confirm their efficacy.
- Chat-GPT is awesome but not perfect, it kept making minor mistakes and requiring multiple prompts to get to the final solution. Side note , I tried BARD too, at this point Chat-GPT is steps ahead of BARD.
- This solution is an activation mechanism, you will still need to read news articles in the mail and then look further into balance sheets and other content to make a buy or sell decision on the stock.